Have you ever used a location related phone application? Chances are the answer is yes. Perhaps you have used your smartphone to “drop a pin” so you could find your car. Maybe you have used a food truck tracker or done a fastest route search. It is common practice to “check-in” to a location on your phone with services such as Facebook and Foursquare. So what is the common denominator? Every time you use a location app, there is some sort of map in the background!
Have you ever wondered where that map came from or how it was made? This summer I got the chance to help build one of those “background” maps. In the world of GIS, they are known as “basemaps”.
In this post I will talk about my internship experience at Esri, the world’s leading software developer for location based technology. I will also talk about some of the invaluable lessons I learned about the future of geospatial intelligence (aka GIS). At the end of this post I make suggestions to college GIS programs (specifically UCLA) on how to leverage web/mobile technology to promote the major.
When Esri’s new desktop software, ArcMap 10, rolled out last year, basemaps were my favorite addition. I would wonder how the basemaps were created and where they came from, they seemed to just appear! This summer I got the answer to my questions when I received the chance to intern at Esri and help develop the World Topographic Map, Esri’s flagship basemap. Click
here to view the Esri World Topo map online.
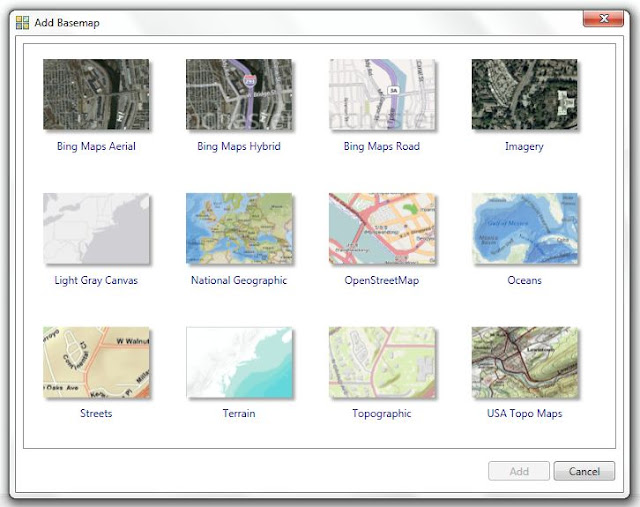 |
| Esri currently offers 12 basemaps |
The division of Esri that creates some of these maps is called the Community Maps Program and they have been full steam at work for the last 3 years to develop the world’s most comprehensive topographic map ever created. The magnitude of this project is larger than has ever been attempted; the goal is to create a map that integrates authoritative GIS data from different communities into one enormous map. You can think of the map as a quilt that is made up of patches; communities that own and maintain their GIS of features such as landscaped areas, streets, buildings, trees and waterbodies can contribute their data and Esri will integrate their patches into the quilt. So far about 620 communities have contributed their data to the map. The main benefit to the contributor for doing this is that Esri will host the basemap in the cloud so it is easily accessible to anyone who needs it. Many contributors have created mobile and web applications that use the map for things such as public works data collection, community maintenance requests and crime reporting.
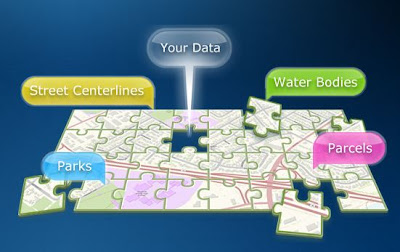 |
Credit: Esri Community Maps Program
|
 |
| Community Maps Template |
During my internship at Esri, I worked on an intern team of 4 and we were each tasked with digitizing our college campuses to integrate into the World Topo basemap. I digitized the University of California, Los Angeles (UCLA) and the other interns digitized Cal State University Long Beach (CSULB), Arizona State University (ASU) and Cal State University San Bernardino (CSUSB).
This exercise was more about learning the process of building a basemap and developing digitizing best practices to share with contributors. Usually a campus would contribute their own data but none of our schools are participants. Currently there are 81 campuses that have contributed their data to Esri’s Community Maps Program. Click on this link to see examples of campuses in the World Topographic map. If any of our schools decide to contribute their data, Esri will swap out what the interns created with the authoritative data owned by the campuses.
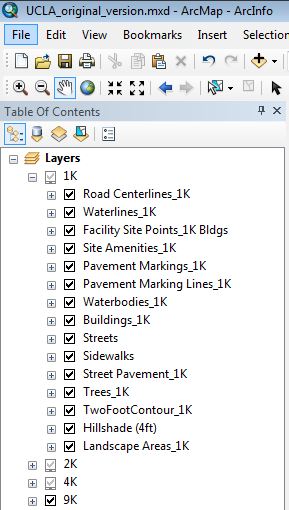
We spent about 3 weeks digitizing our campuses from scratch and it was the first time I had ever worked in a template. We digitized at four scales: 1:9K, 1:4.5K, 1:2K and 1:1K (farther out to closer in). It took me a while to wrap my head around how to do this. The idea is that the farther out you are on the map, fewer details appear and as you zoom in closer more details show up. The main way to control what shows up at different scales is through something called “definition queries”. Basically by using Structured Query Language (SQL), you can form statements (aka definition queries) such as: [“Area” > 900] and this could mean something like: only display the building labels at the 1:2K scale if the area is greater than 900 meters squared.
I also gained experience with a geodatabase called the “Local Government Information Model” (LGIM). The Local Gov’t model is a standardized way of organizing a municipality’s GIS data and it is also the required format for submitting one’s data to the Community Maps Program. The model can be downloaded from
here.
I had worked within an information model once before when I helped the City of Los Angeles
find a new park location; I was able to apply that knowledge when I started working with the LGIM.
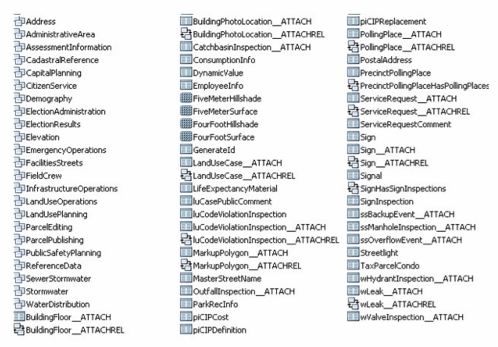 |
This is the full Local Government Information Model. Municipalities use this to organize their GIS. The Community Maps Program only utilizes a small subset from this model such as streets, buildings and landscape
|
In the campus digitizing process I came up with some pretty impressive statistics for UCLA. Did you know that if you walked on every single sidewalk at UCLA, you would walk 27 miles?! That’s more than a marathon! Can you guess how many trees there are at UCLA? Well I can't be certain because I did not digitize trees at 1:1, but I digitized roughly 13,500! Yes ladies and gentlemen, that means I clicked my mouse 13,500 times! I did this in 6 hours; that’s cyber tree planting madness at 37 clicks a minute folks! I am proud to say that over 120 hours of digitizing later, I am a master!
UCLA by numbers:
· 419 acres
· 174 buildings
· 15 parking structures
· 18 landmarks
· 40,675 student population
· 27 miles of sidewalk
· ~13,500 trees
My internship at Esri also exposed me to a critical part of GIS that I had never encountered before – Quality Control (QC). Performing quality control checks and double checks is common practice at Esri. I learned how to use Esri’s Data Reviewer extension to perform visual and automated QC checks. I also cross referenced the map I created with UCLA’s official map for accuracy.
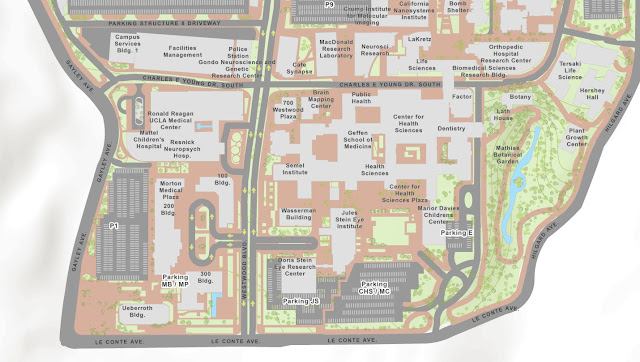
Just so you understand what maps are currently out there, here is what UCLA looks like in Satellite Imagery, Google, Bing, Esri’s World Streets, UCLA’s interactive map and Esri’s World Topographic map (before my addition):
Esri Satellite Imagery (2010)
Google
Esri Streets Map
Bing
Esri World Topographic Map
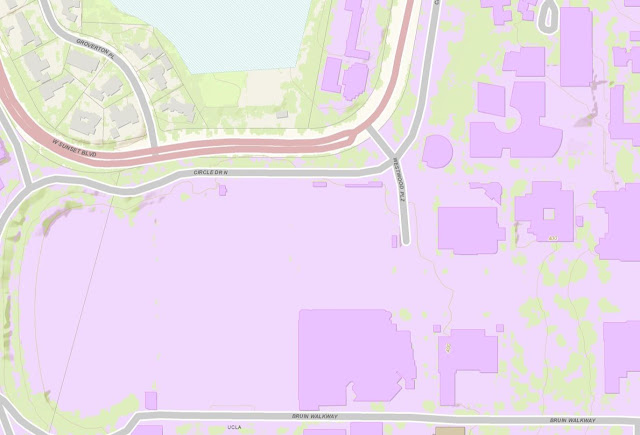
As you can tell the Bing, Google and Esri maps are relatively empty. The only map that has a high level of detail is UCLA’s interactive map (the authoritative data steward) so it takes 1st place. The google map takes 2nd place because it does a good job of labeling the campus and it has some general symbolization for grass, buildings, pavement and sports fields. The Esri World Streets map comes in 3rd place because there are some digitized features such as the track and field stadium; however the labeling is sparse and the digitizing quality is poor. The bing map come in 4rd place because it has buildings, a few building labels and sidewalks. The Esri World Topographic map comes in last place (for UCLA's campus) because it only has buildings, contours and NDVI generated vegetation. My goal was to change that and put the Esri World Topo map in 1st!
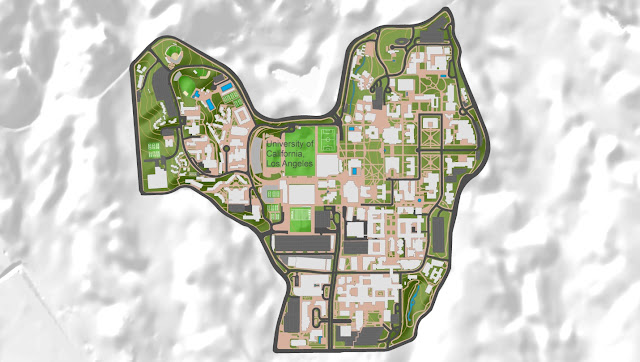
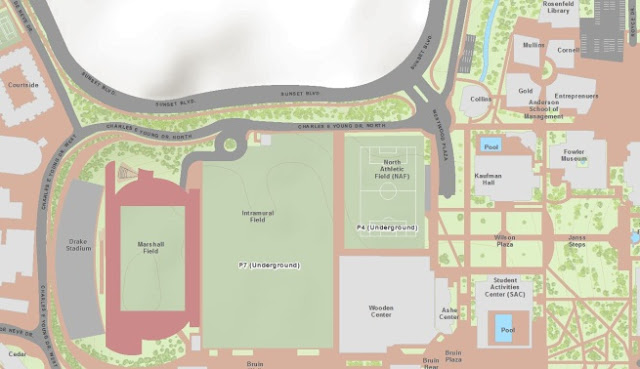
This is what I came up with:
Looks pretty good, right?! The image above shows the campus at the 1:4,500 scale (4.5K).
A few weeks after we finished digitizing our college campuses, the Community Maps Program came out with a brand new cartographic template. The interns were asked to change our maps over to the new template. The colors in the new template are much more toned down. Since the basemap is intended to be a reference map, the subtle “in-the-background” look is more suitable. This way it is easier for users to overlay operational layers (things that change) on top of the basemap (ie updated campus shuttle routes, construction zones, building hazards, etc).
 |
| Old cartography |
 |
| New cartography |
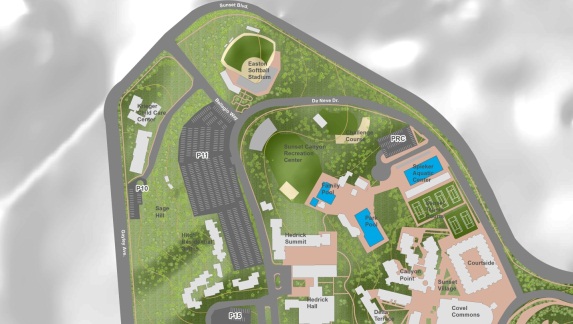 |
| Old cartography (zoomed in on UCLA Sunset recreation) |
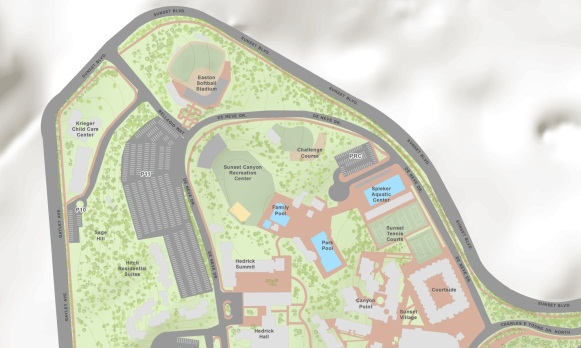 |
| New cartography (zoomed in on UCLA Sunset recreation) |
This is what Esri’s World Topographic map will look like this when my digitized UCLA campus is integrated into the basemap:
 |
| Esri’s World Topographic map (currently) |
 |
| Esri’s World Topographic map (after my addition) |
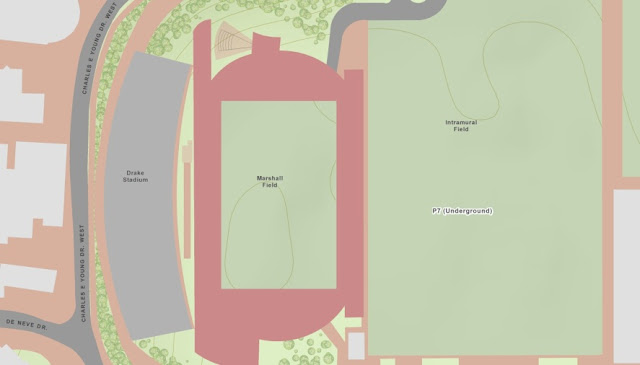
The following images will show the final campus map at the different scales (1:9000 to 1:1000) and special areas of interest.
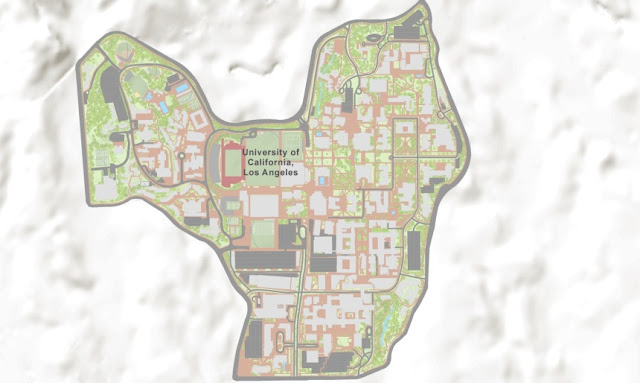 |
| 1:9000 |
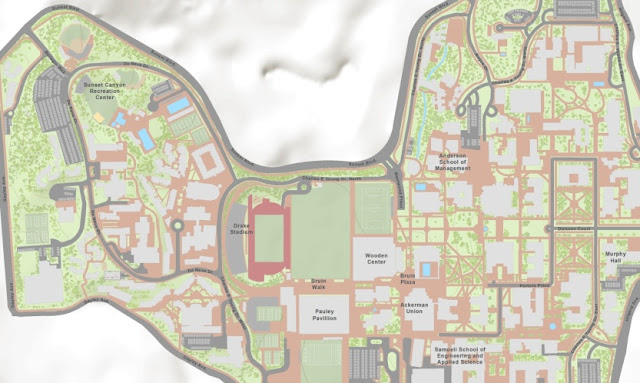 |
| 1:4,500 |
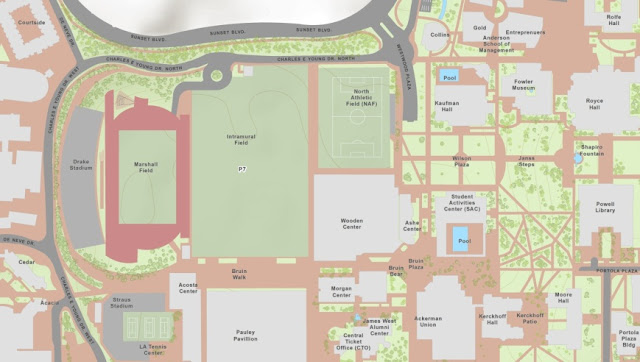 |
| 1:2,000 |
 |
| 1:1,000 | | |
 |
| 1,1000 |
Suggestion to UCLA (and other college campuses):
Since UCLA is now going to be part of the Esri basemap, it would be awesome if some GIS students developed a campus application that allowed smartphone users to geotag special events, sports games, crime incidents etc! Other campuses can do this too, they just need to digitize their campus and submit it to Esri. Click on
this link to get info on how to participate in the Community Maps Program.
If you want to promote the GIS program and show off how awesome GIS is …then this is what you can do. Collaborate with Computer Science and GIS students to develop a mobile app that on its most basic level helps students find places. Then incorporate a community editing aspect that allows the student body to participate.
 |
| QR code |
Get the Den Sports Club involved and have them update all sports events. Get student associations such as ASUCLA, SAA, SEC and USAC involved with campus events updates. Have bruin alerts be geotagged! Get social media involved (youtube, twitter, facebook) – did a
fantastic dancing flash mob wedding proposal just occur in the middle of Bruin Plaza? Tag the video right onto the map! Sky is the limit, whatever other applications you can think of.
Have someone present the application during freshman orientation to each group that comes through and make it downloadable straight from
www.UCLA.edu. Put QR codes around campus that link to the app download. Have students blog about the app, have the Daily Bruin cover it, do a press release to local TV stations. Say that people in the GIS major did it! This could be a big class project for a Web/mobile GIS class. Do this and people will be flocking to Geography/GIS major, it will grow faster than you ever imagined. People will figure out that GIS is a valuable major and YES you can get a job! Web/mobile GIS is the wave of the future, hop on board people!


