Monday, November 26, 2012

Top 5 Marketable GIS Skills


Geography majors are lucky because unlike other disciplines in the humanities, geographers get the unique opportunity to specialize in Geographic Information Systems (GIS), a powerful technological tool used in just about every industry. GIS is a highly marketable skill that directly translates into a career path.

After completing the GIS minor at UCLA, I got the chance to put all of the skills I learned to the test during my summer internship at Esri, one of the world’s largest innovators in GIS technology.  During my time at Esri, I found shocking holes in my GIS education. I could not believe that some of the largest trends in the industry were almost completely ignored from my curriculum. I quickly realized that if I wanted to make GIS into a career, I would have to supplement my UCLA education with some more specialized knowledge. That’s when I decided to ask almost everyone I talked to at Esri this question:  

 “What are the most marketable skills for a GIS Professional?”

                I wanted to share the responses I received with other fellow GIS students and graduates so that they too could figure out where to focus their efforts beyond the basic GIS fundamentals. Across the table, the same things came up over and over again. Here are the top five marketable skills for a GIS Professional:


1.     Web/Mobile is the largest trend in GIS. Web/Mobile technology takes GIS from the hands of millions to the hands of billions. From GPS navigation to location based apps, such as Waze Social GPS & Traffic, Foursquare and Shopkick, there is an enormous opportunity for employment and entrepreneurship. “Cloud computing” is the big buzz word in the geospatial community this year. The primary GIS technology to learn about is ArcGIS for Server, which will allow you to create, manage and distribute web and mobile GIS applications. The main obstacle for students who want to learn ArcGIS for Server is the lack of a Web GIS class offered to the student body. Upon graduating from UCLA, I took a course in Web GIS through UC Riverside Extension with one of the pioneers of web GIS, Esri’s Senior Web Applications Developer, Pinde Fu. I found the course to be valuable and I suggest that GIS students express a desire to their department to have a “Development for Web GIS” course added to their curriculum. You will need to learn about client-server applications and web architecture; this can be accomplished in an intro level Computer Science course in web technology. You will also need to gain some development skills such as learning how to use JavaScript, Silverlight or Flex APIs (Application Programming Interfaces) to create mashup applications (which dynamically combine content or functions from multiple Web sites). The best way to learn is to come up with an idea for an app and then develop it through trial by fire. To gain experience, I propose that some students develop this app idea that I came up with. 
(Contributed by Brian Sims, Tom Wayson, Pinde Fu, Seth Sarakaitis, Mark Stewart, Ashley Pengelly, Lara McLaughlin, Tim Daly, Chris D’Amour) 


2.       Database Administration and Management are highly sought after skill sets; they are the glue that hold GIS together. In the working world, there are often multiple users working on the same geodatabase. That means that the data needs to be in a central repository so that the data can be simultaneously edited or used. Currently, the main technology to accomplish this is Esri’s ArcSDE. A budding technology to accomplish this is cloud storage; however there are still privacy issues surrounding the “cloud” solution. Different users of the data may require varied levels of permission to access different parts of the database. That is where a database administrator comes into play, the admin must have a working knowledge a Database Management System (DBMS) such as Oracle, SQL Server, SQL Server Express, MySQL or PostgresSQL (the last three mentioned are free). Another very important thing to learn is how to form Structured Query Language (SQL) statements. To gain familiarity with these highly marketable skills, take at least one intro level class in SQL and basic database administration.  I suggest that GIS students express a desire to their department to have a “GIS Database Administration” course added to their curriculum.

(Contributed by Seth Sarakaitis, Mark Stewart, Tom Wayson, Brian Sims, Ashley Pengelly, BJ Swanner, Chris D’Amour) 


3.       Programming skills will set you apart from the rest of the pack. The automation of repetitive procedures will make you a more effective GIS Professional, especially in data intensive environments where a lot of geoprocessing needs to occur. The learning curve for programming is steep and requires a lot of upfront time investment before you will see a return on your efforts. Getting a strong technical grounding early in your career will make you a better communicator. Luckily, the best language for GIS is Python, which is relatively easy to learn compared to other programming languages. Not only are most ArcGIS geoprocessing tools built using python but a vast majority of big-name web services are built on python. This list includes Gmail, Google Maps, YouTube, reddit, Spotify, turntable.fm and Yahoo! Groups. Learning Python will be worth your time and once you know enough in one language, you can easily pick up other programming languages. I stumbled upon a course by a programmer who was fed up with the lack of resources to learn Python. He decided to write his own 200 page e-book called Real Python geared towards first time programmers. For $14, you can buy the e-book, receive hundreds of examples of code, and gain access to the course’s online member forum. This is great place to start. 
      If you are interested in web GIS development and building web apps, you should invest your time in learning JavaScript. The main advantage to JavaScript is that it is supported by all browsers so it can reach the largest amount of people. A good resource for learning JavaScript for free is Codecademy
     (Contributed by Greg Pleiss, Guy Noll, Lisa Stanners, Jaisudha Purushothaman, Pinde Fu, Lara McLaughlin, Tim Daly, Tom Wayson, Brian Sims, Matt Bottenberg) 


4.       IT knowledge – A GIS Professional is often the most technical member of a cross-disciplinary team. Because of this, GIS Professionals will often be looked to for their technical expertise even if the nature of an issue is well outside their job description. It is crucial for the GIS professional to become familiar with the fundamental technology that supports a GIS, including desktop and server operating systems and database management systems. The ability to troubleshoot both  spatial data issues and also SQL security and server connections is often what separates a GIS analyst from a GIS professional. Consider taking an introductory course in Information Technology (IT) as well as following trends in technology. (contributed by BJ Swanner)
   
      It is important to gain some equipment expertise. As a GIS Professional, your main job will be to work with data and you will need to be knowledgeable of how that data is created (ex. GPS, Trimble, EchoSounder, etc). If you can answer what makes the data collection method good and what makes it bad, then you are on the right track. (contributed by Guy Noll, Matt Bottenberg) 


5.       Interpersonal skills are critical in the work place. You need to be able to communicate with large spectrum of people, from non-technical clients to highly technical developers. This skill is intangible but crucial to your success as a GIS Professional. When a GIS professional possesses a unique combination of technical skill and interpersonal skills, they tend to rise up through organizations very quickly. This role as “information liaison” is a coveted position and very marketable. The 80/20 rule of interpersonal skills says that GIS work is 80% relationships and 20% technology. Whenever you have opportunities to work in groups and make presentations, take them!

(Contributed by Doug Cribbs, Greg Pleiss, Bill Earnshaw, Daryl Smith, Mike Wilbern, BJ Swanner).


Keep in mind that these top 5 marketable skills are above and beyond the basic GIS fundamentals. The list is intended to be a guide for students who are already working towards a concentration in GIS, who are looking for ways to set themselves apart from the rest of their competition. You will notice that these top marketable skills are much more related to Computer Science than to Geography. Consider taking on a second minor in Computer Science (CS) or taking supplemental coursework at a community college.

A lot of people think of GIS as just a tool that they will use in some other field.  This is fine if you want to be a professional in another field, but if you want to be a GIS Professional then you should put in the extra hours to learn some Computer Science skills (contributed by Brian Sims).

In conclusion, college GIS courses typically teach students the skills to perform GIS analysis. Students interested in pursuing a career in GIS will need to augment those skills with broader IT and CS skills including data management, IT infrastructure (virtualization, etc), and programming. If you take the time to strengthen your abilities in these areas, you will surpass your competition (contributed by Tom Wayson). 


Idea For a New UCLA Mobile App


I am proposing an idea for a mobile app that will promote UCLA’s GIS program and offer students a chance to gain some highly marketable skills. This mobile app will be unlike any other ever created for UCLA. On the application’s most basic level, it will help students, faculty and guests find where they are going. The app will then incorporate a community editing aspect that allows the student body and university to participate by tagging events right onto the map. Developing this app will require collaboration between Computer Science and GIS students as well as some professors willing to volunteer their time and expertise.

Web/mobile technology is one of the largest trends in not only GIS but in the world. The students who build this app will gain real world experience and set themselves up for a job right after college. This would be an incredible opportunity for some motivated individuals to rise above and beyond the rest of the pack.


What Map Phone Apps Currently Exist for UCLA?

I conducted a Google search to see what location based apps for Android and iPhone exist for UCLA. I found two apps and tested them out on my handset. “UCLA Pinpoint” is an app that uses the google basemap API; however, instead of calculating the shortest route between buildings, it simply draws a straight line from Point A to Point B. This is not very helpful, good luck walking through walls!


The other app is “UCLA Mobile”, UCLA’s main app for the campus. The app features several modules that include News, Happenings Calendar, Directory, Map, BruinBus and more. The Map tab takes you to a window which allows you to “Search for Location” or “Browse Locations”. The app uses UCLA’s Interactive Map as the basemap. There is a nifty feature which allows you to ask for walking, biking or driving directions. However, when I asked for walking directions from Royce Hall to the Bruin Bear, it sent me on an epic 1,962 mile journey starting in Platteville, WI. The BruinBus tab provides students with real time estimates of next bus arrival time as well as shows bus routes on the map.


With current GIS technology, we have an opportunity to do SO MUCH BETTER. 


What Will the Proposed App Do and How Will You Build It?

This app will be a mashup, meaning that it will dynamically combine content or functions from multiple sources.

Not only could this app succeed at providing the shortest route between buildings, but it could take you right to your classroom doorstep. If you have ever tried to find your class in Math Sciences, then you know how useful this would be (hint: you enter this labyrinth on the 5th floor).  Esri has already created a customizable app called Campus Place Finder (ArcGIS 10.1). The student development team would need to download this app’s JavaScript source code and configure it for UCLA’s campus. The development team would need to gain access to the facilities management GIS data. 


What if you could sync up the class schedule to the map? You would know what class was happening in every room at any given moment. No more walking into the wrong classroom!

The coolest part of the map would involve the community editing aspect. If you get the Den Sports Club involved, they could update all sports events. Student associations and governing bodies such as ASUCLA, SAA, SEC and USAC could provide campus event updates. The hundreds of clubs on campus could tag their events right onto the map. Imagine walking through campus and being able to see what is going on all over campus at that moment.

Have BruinAlerts be geotagged. Did a lab in Engineering IV just go up in flames or was there a robbery in John Wooden Center? These pieces of security information are location based and should be on a public map right when they occur.

Get social media involved (youtube, twitter, facebook) – did a fantastic dancing flash mob wedding proposal just occur in the middle of Bruin Plaza? Tag the video right onto the map in the very spot where it happened!

As for the app’s basemap, I digitized UCLA’s campus to integrate into the Esri World Topographic Basemap. Since I am not the authoritative data holder for UCLA, my contribution to the Esri basemap should be swapped out with official UCLA GIS data. This will require the UCLA GIS program to participate in Esri’s Community Maps Program. Over 80 college campuses have already taken advantage of this program and allowed Esri to host their basemap for them. Click on  this link to get info on how to participate in the Community Maps Program.

Another important resource to develop this app is the Mobile Web Framework (MWF) initiative, a group at UCLA dedicated to mobile development. They have biweekly developer meetings at UCLA and their expertise may prove to be integral in the development of this app. MWF collaborated with UCLA to develop “UCLA Mobile”.

        One of the first steps to developing this app would be to create something called a "wireframe" using a website such as www.balsamiq.com.  A "wireframe" is a concept design mockup, it can be used to pitch the app as well as communicate basic design requirements. 


Spreading the Word & Growing the GIS Program


A great way to market the app would be to have a student present the application during freshman orientation to each group that comes through and make the app downloadable straight from www.UCLA.edu. Placing QR codes around campus that link to the app download would generate a public conversation. Have students blog about the app, have the Daily Bruin cover it, do a press release to local TV stations. Say that people in the GIS Program did it!
QR Code

This app would showcase the possibilities of GIS and get people excited about the joining the program. While UCLA is primarily a research institute, it would be beneficial to the university to cultivate a more practical hands-on approach to the GIS Program. The theoretical overload and outdated lab tutorials that were presented to me in “Geography 7: Intro to GIS” almost made me quit GIS altogether. If the Geography department can re-brand the GIS program as forward-thinking and tech-savvy, the university will not only see more cutting edge research being performed, but it will see more students getting jobs. My suggestion to the UCLA Geography Department is that they add “Development for Web/Mobile GIS” to the curriculum. The app development could even be a big class project for a Web/mobile GIS class. Do this and people will be flocking to Geography/GIS major, it will grow faster than the department ever imagined. People will figure out that GIS is a valuable discipline and YES you can get a job! Web/mobile GIS is the wave of the future, hop on board people!


If you are a UCLA student, Faculty Member, Professor or Esri employee interested in helping develop this app, please e-mail me at kelsey.ck@ucla.edu and I will bring you into the loop! 


Monday, September 17, 2012

My Esri Internship Experience


Have you ever used a location related phone application? Chances are the answer is yes. Perhaps you have used your smartphone to “drop a pin” so you could find your car. Maybe you have used a food truck tracker or done a fastest route search. It is common practice to “check-in” to a location on your phone with services such as Facebook and Foursquare. So what is the common denominator? Every time you use a location app, there is some sort of map in the background! 

Have you ever wondered where that map came from or how it was made? This summer I got the chance to help build one of those “background” maps. In the world of GIS, they are known as “basemaps”.  

In this post I will talk about my internship experience at Esri, the world’s leading software developer for location based technology. I will also talk about some of the invaluable lessons I learned about the future of geospatial intelligence (aka GIS). At the end of this post I make suggestions to college GIS programs (specifically UCLA) on how to leverage web/mobile technology to promote the major.


When Esri’s new desktop software, ArcMap 10, rolled out last year, basemaps were my favorite addition. I would wonder how the basemaps were created and where they came from, they seemed to just appear! This summer I got the answer to my questions when I received the chance to intern at Esri and help develop the World Topographic Map, Esri’s flagship basemap. Click here to view the Esri World Topo map online.


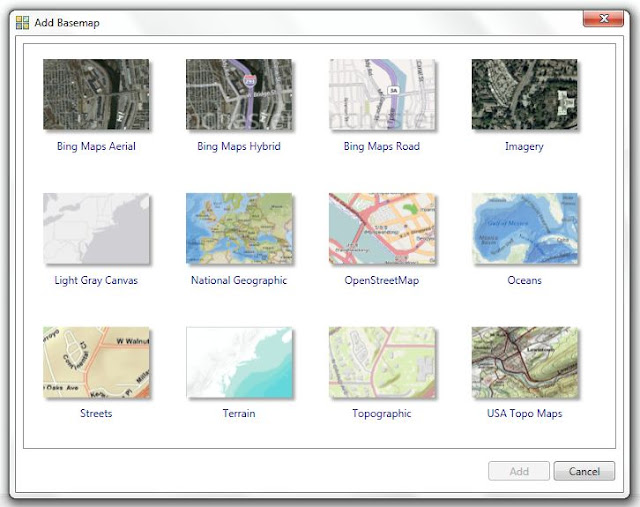
Esri currently offers 12 basemaps

 
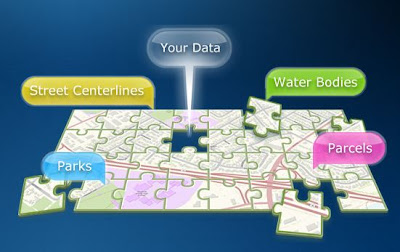
The division of Esri that creates some of these maps is called the Community Maps Program and they have been full steam at work for the last 3 years to develop the world’s most comprehensive topographic map ever created. The magnitude of this project is larger than has ever been attempted; the goal is to create a map that integrates authoritative GIS data from different communities into one enormous map. You can think of the map as a quilt that is made up of patches; communities that own and maintain their GIS of features such as landscaped areas, streets, buildings, trees and waterbodies can contribute their data and Esri will integrate their patches into the quilt. So far about 620 communities have contributed their data to the map. The main benefit to the contributor for doing this is that Esri will host the basemap in the cloud so it is easily accessible to anyone who needs it. Many contributors have created mobile and web applications that use the map for things such as public works data collection, community maintenance requests and crime reporting. 

Credit: Esri Community Maps Program


Community Maps Template


During my internship at Esri, I worked on an intern team of 4 and we were each tasked with digitizing our college campuses to integrate into the World Topo basemap. I digitized the University of California, Los Angeles (UCLA) and the other interns digitized Cal State University Long Beach (CSULB), Arizona State University (ASU) and Cal State University San Bernardino (CSUSB). This exercise was more about learning the process of building a basemap and developing digitizing best practices to share with contributors. Usually a campus would contribute their own data but none of our schools are participants. Currently there are 81 campuses that have contributed their data to Esri’s Community Maps Program. Click on this link to see examples of campuses in the World Topographic map. If any of our schools decide to contribute their data, Esri will swap out what the interns created with the authoritative data owned by the campuses.


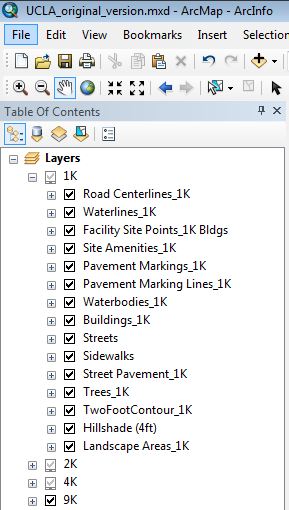
We spent about 3 weeks digitizing our campuses from scratch and it was the first time I had ever worked in a template. We digitized at four scales: 1:9K, 1:4.5K, 1:2K and 1:1K (farther out to closer in). It took me a while to wrap my head around how to do this. The idea is that the farther out you are on the map, fewer details appear and as you zoom in closer more details show up. The main way to control what shows up at different scales is through something called “definition queries”. Basically by using Structured Query Language (SQL), you can form statements (aka definition queries) such as: [“Area” > 900] and this could mean something like: only display the building labels at the 1:2K scale if the area is greater than 900 meters squared.


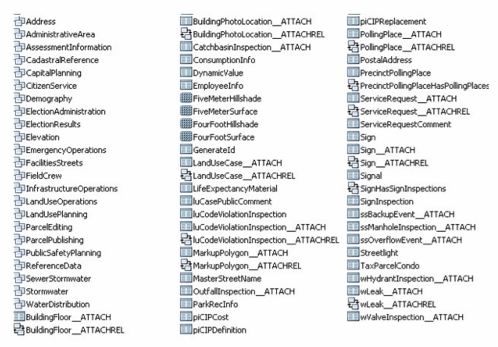
I also gained experience with a geodatabase called the “Local Government Information Model” (LGIM). The Local Gov’t model is a standardized way of organizing a municipality’s GIS data and it is also the required format for submitting one’s data to the Community Maps Program. The model can be downloaded from here. I had worked within an information model once before when I helped the City of Los Angeles find a new park location; I was able to apply that knowledge when I started working with the LGIM. 


This is the full Local Government Information Model. Municipalities use this to organize their GIS. The Community Maps Program only utilizes a small subset from this model such as streets, buildings and landscape


In the campus digitizing process I came up with some pretty impressive statistics for UCLA. Did you know that if you walked on every single sidewalk at UCLA, you would walk 27 miles?! That’s more than a marathon! Can you guess how many trees there are at UCLA? Well I can't be certain because I did not digitize trees at 1:1, but I digitized roughly 13,500! Yes ladies and gentlemen, that means I clicked my mouse 13,500 times! I did this in 6 hours; that’s cyber tree planting madness at 37 clicks a minute folks! I am proud to say that over 120 hours of digitizing later, I am a master!


UCLA by numbers: 

·         419 acres
·         174 buildings
·         15 parking structures
·         18 landmarks
·         40,675 student population
·         27 miles of sidewalk
·         ~13,500 trees


My internship at Esri also exposed me to a critical part of GIS that I had never encountered before – Quality Control (QC). Performing quality control checks and double checks is common practice at Esri. I learned how to use Esri’s Data Reviewer extension to perform visual and automated QC checks. I also cross referenced the map I created with UCLA’s official map for accuracy. 

Just so you understand what maps are currently out there, here is what UCLA looks like in Satellite Imagery, Google, Bing, Esri’s World Streets, UCLA’s interactive map and Esri’s World Topographic map (before my addition):  


Esri Satellite Imagery (2010)


Google 

 Esri Streets Map

Bing

Esri World Topographic Map


As you can tell the Bing, Google and Esri maps are relatively empty. The only map that has a high level of detail is UCLA’s interactive map (the authoritative data steward) so it takes 1st place. The google map takes 2nd place because it does a good job of labeling the campus and it has some general symbolization for grass, buildings, pavement and sports fields. The Esri World Streets map comes in 3rd place because there are some digitized features such as the track and field stadium; however the labeling is sparse and the digitizing quality is poor. The bing map come in 4rd place because it has buildings, a few building labels and sidewalks. The Esri World Topographic map comes in last place (for UCLA's campus) because it only has buildings, contours and NDVI generated vegetation. My goal was to change that and put the Esri World Topo map in 1st

This is what I came up with: 


Looks pretty good, right?! The image above shows the campus at the 1:4,500 scale (4.5K). 

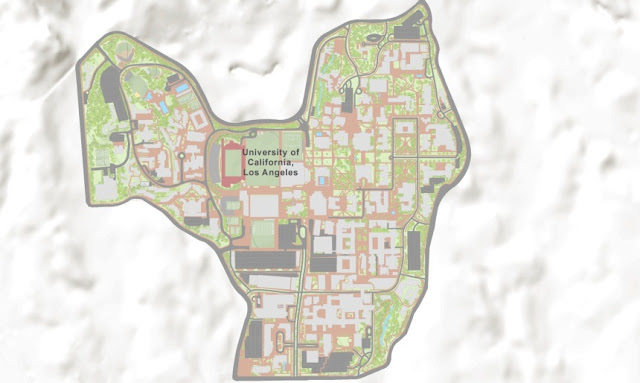
A few weeks after we finished digitizing our college campuses, the Community Maps Program came out with a brand new cartographic template. The interns were asked to change our maps over to the new template. The colors in the new template are much more toned down. Since the basemap is intended to be a reference map, the subtle “in-the-background” look is more suitable. This way it is easier for users to overlay operational layers (things that change) on top of the basemap (ie updated campus shuttle routes, construction zones, building hazards, etc).

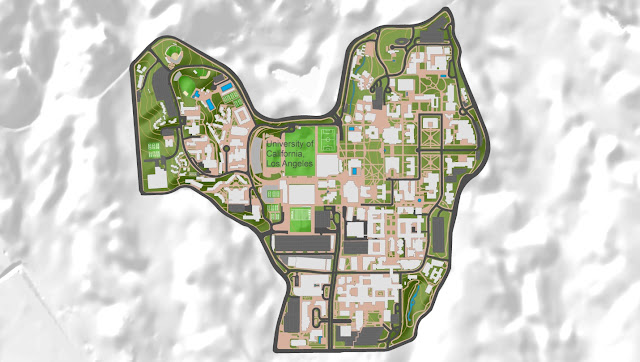
Old cartography
New cartography

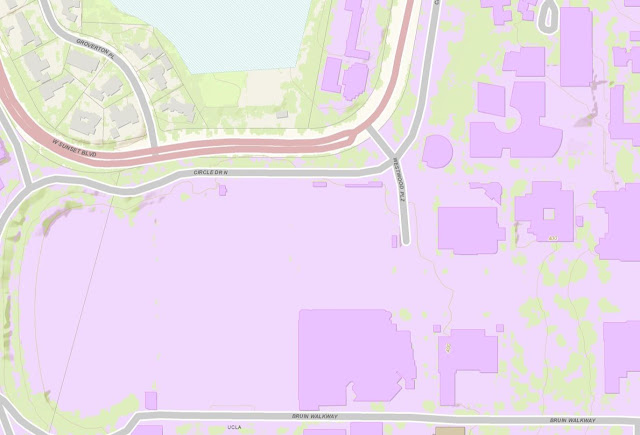
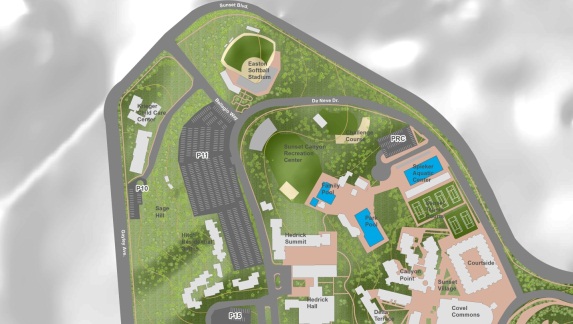
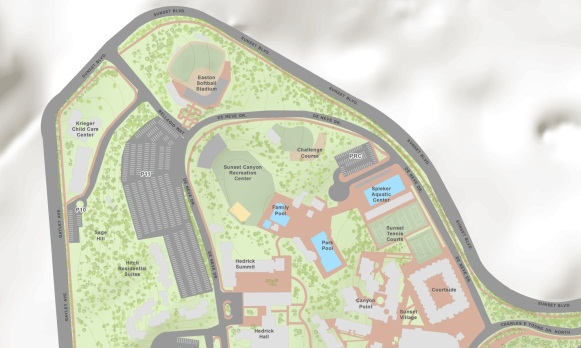
Old cartography (zoomed in on UCLA Sunset recreation)
New cartography (zoomed in on UCLA Sunset recreation)


This is what Esri’s World Topographic map will look like this when my digitized UCLA campus is integrated into the basemap:


Esri’s World Topographic map (currently)

Esri’s World Topographic map (after my addition)


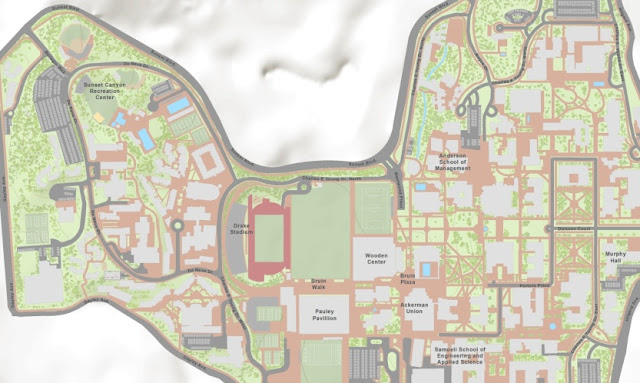
 The following images will show the final campus map at the different scales (1:9000 to 1:1000) and special areas of interest.


1:9000

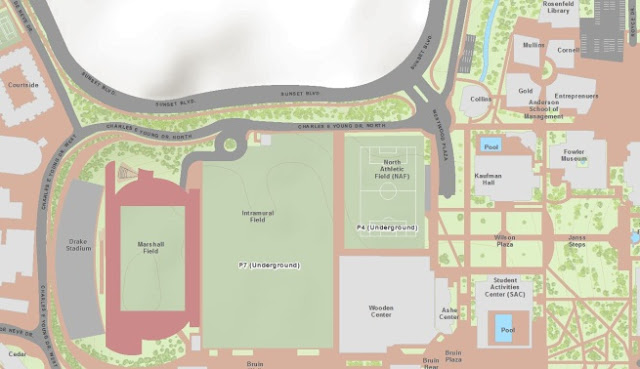
1:4,500

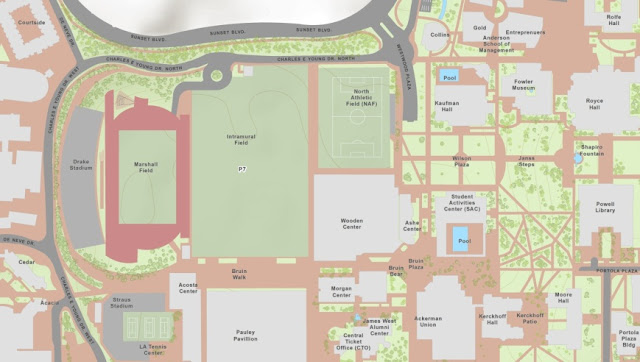
1:2,000

1:1,000

1,1000


Suggestion to UCLA (and other college campuses):

Since UCLA is now going to be part of the Esri basemap, it would be awesome if some GIS students developed a campus application that allowed smartphone users to geotag special events, sports games, crime incidents etc! Other campuses can do this too, they just need to digitize their campus and submit it to Esri. Click on this link to get info on how to participate in the Community Maps Program.

If you want to promote the GIS program and show off how awesome GIS is …then this is what you can do. Collaborate with Computer Science and GIS students to develop a mobile app that on its most basic level helps students find places. Then incorporate a community editing aspect that allows the student body to participate. 

QR code
Get the Den Sports Club involved and have them update all sports events. Get student associations such as ASUCLA, SAA, SEC and USAC involved with campus events updates. Have bruin alerts be geotagged! Get social media involved (youtube, twitter, facebook) – did a fantastic dancing flash mob wedding proposal just occur in the middle of Bruin Plaza? Tag the video right onto the map! Sky is the limit, whatever other applications you can think of. 

Have someone present the application during freshman orientation to each group that comes through and make it downloadable straight from www.UCLA.edu. Put QR codes around campus that link to the app download. Have students blog about the app, have the Daily Bruin cover it, do a press release to local TV stations. Say that people in the GIS major did it! This could be a big class project for a Web/mobile GIS class. Do this and people will be flocking to Geography/GIS major, it will grow faster than you ever imagined. People will figure out that GIS is a valuable major and YES you can get a job! Web/mobile GIS is the wave of the future, hop on board people!

Friday, July 27, 2012

Custom Python Script - Batch Raster Extractor

Introduction 


This code was created during a Programming and Development for GIS course at UCLA during Winter 2012. The purpose of the code is intended for research conducted by Dr. Thomas Gillespie of the UCLA Geography Department, however the code can be used for a variety of applications.

Dr. Gillespie's research involves identifying global biodiversity hotspots that have seen significant landcover change. The data set being used is called the GLOBCOVER project and it is created by the European Space Agency (ESA). The data is a satellite imagery raster that has been classified into landcover types. A new data set is created every few years and Gillespie's research goal is to compare eco-regions, countries and protected areas over time to look for forest degradation.

To help solve this research question, this code produces statistics of landcover area (km2) and percentage land cover (%) for polygons (ie eco-regions, countries and protected areas). This is accomplished by using the polygons to extract pixel data from the GLOBCOVER raster. In order to do a temporal comparison, a separate code would be required to draw comparison statistics.


Technical Code Description:
The Batch Raster Extractor is meant to provide a standard and repeatable way to extract raster data using the polygons of a vector file. The script operates in four main steps. First, the user inputs the vector file and raster file of interest. Second, a split by attribute tool is used to export each polygon into a separate shapefile. Third, each polygon is masked on top of the raster and used to extract a subset of the raster. Fourth, statistics are calculated for each raster subset, Area and Percentage fields are appended to the attribute tables of each subset.

Code Requirements:
To use this code, the user must have Python 2.6 for ArcGIS 10 (or above) installed. A custom python script called "Split Layer by Attributes" is used in this code, it must be downloaded for this code to work from this link. User must have licensing for ArcGIS Spatial Analyst Extension.

Code Usage Guide:
  1. Copy and past code below into Python IDLE window and save as a .py. 
  2. Change / modify the ten lines in the code that have a comment on the right hand side in green (indicated by ' ### '  )
  3. Save  [ CTRL + S ]
  4. Run [ F5 ]
Trouble Shooting
  1. If code returns a 'NoneType' error, close all files (including ArcMap, IDLE and shell) and re-run code. (This error is due to the code's use of the custom tool "Split Layer By Attributes"
  2. If code crashes while running, it is possible that polygons exist in the vector file that do not have corresponding raster data to extract. To fix this, manually remove those polygons in ArcMap.

Code broken down into pictures:


Step 1: 

Specify two inputs 

1. Vector Layer
  • example = shapefile of all countries in world


2. Raster Layer
  • example = GlobCover , European Space Agency (ESA) 


Step 2: 

Split apart shapes within vector file and save each as a separate shapefile (.shp)


Step 3: 

Use geometry of each shape to "cookie cutter" raster and save each subset as a raster file


Step 4: 

Calculate pixel statistics 
  •  will append attribute table with Area (Km2) and Percentage fields (this screen shot is from an earlier iteration of the code when the percentage field was not populating correctly, this bug has since been fixed)


PYTHON CODE


'''BatchRasterExtractor.py

Author:
  Kelsey Kaszas
  Dept of Geography and Environmental Studies
  University of California, Los Angeles, USA
  kelsey.kaszas@gmail.com
  Special Thanks to Jida Wang 

Date created April 9 2012
Modified     July 27 2012

Purpose:
  Converts each shape in a feature class into a separate shapefile.
  Uses individual shapefiles to extract raster data by mask.
  Appends extracted raster files with "Value", "Area", and "Percent" fields. 
  Final output is a folder with masked raster subsets. 

Code Requirements:
  This code requires the user to have Python 2.6 for ArcGIS 10 (or above) installed on computer
  This code uses a custom python script called "Split Layer By Attributes" that can be downloaded from: http://arcscripts.esri.com/details.asp?dbid=14127
  This code requires ArcGIS Spatial Analyst Extension
  
Code Usage Guide [ IMPORTANT ] :
  1. change the ten places in code that have a comment on the right hand side (indicated by ' ### ') 
  2. save code [ CTRL + S ]
  3. run code [ F5 ]
  
Troubleshooting:
  1. If code returns a 'NoneType' error, close all files and re-run code
     (this error is due to the code's use of the custom tool "SplitLayerByAttributes")
  2. If code crashes while running, it is possible that polygons exist in the vector file that do not
     have corresponding raster data to extract. To fix this, manually remove those polygons using ArcMap
     
   
'''
#--------------------------------------------------------------------

#import system module 
import arcpy, os
from arcpy import env
from arcpy.sa import * 

#enable overwrite 
arcpy.env.overwriteOutput = True

#define filepath
filepath = r"D:\My Documents\RASTER_EXTRACTER"                                      ### change path to workspace folder
arcpy.ImportToolbox(r"D:\My Documents\SplitLayerByAttributes.tbx")                  ### change path to location of "Split Layer By Attributes" toolbox .tbx
symbologyLayer = r"D:\My Documents\GlobCover_Legend.lyr"                            ### comment out or delete this line if there is NO symbology .lyr file 


#set parameters 
#vector = arcpy.GetParameterAsText(0)
vector = r"D:\My Documents\vector.shp"                                              ### change path to vector dataset 


#raster = arcpy.GetParameterAsText(1)
raster = r"D:\My Documents\raster.tif"                                              ### change path to raster dataset

#out_vector = arcpy.GetParameterAsText(2)
out_vector = r"D:\My Documents\vector_output"                                       ### change path and change \vector_output to name of folder that will contain individual shapefiles
out_vector = str(out_vector)
os.makedirs(out_vector)

#out_raster = arcpy.GetParameterAsText(3)
out_raster = r"D:\My Documents\raster_output"                                       ### change path and change \raster_output to name of folder that will contain subset raster files                                                                                 
out_raster = str(out_raster)
os.makedirs(out_raster)

#set workspace environment 
arcpy.env.workspace = out_vector

#input pixel size of raster
z = ???                                                                             ### change ??? to pixel size of raster (units in meters) (example: z = 300)                                                           

#[SPLIT]
#_________________________________________________________________________

print("running split...")

#print(out_vector)

name_vector = '???'                                                                 ### choose naming convention: change ??? to the field name from original shapefile that output vector naming convention will be based on
arcpy.SplitLayerByAttributes(vector, name,"_",out_vector)                                                                          
print("split completed")

#[MASK]
#________________________________________________________________________

print("adding symbology layer to original raster file")
arcpy.ApplySymbologyFromLayer_management (raster, symbologyLayer)                   ### Comment out or delete this line of code if there is NO symbology .lyr file


#Check out the ArcGIS Spatial Analyst extension license
arcpy.CheckOutExtension("Spatial")


print("running mask of shapefile output")
for file1 in os.listdir(out_vector):    
    if file1.endswith(".shp"):
        
        #cursor out name of individual vector outputs for raster file naming convention 
        name = arcpy.SearchCursor(file1)
        for name_1 in name:
            raster_name = name_1.name_vector
            break       

        # Execute ExtractByMask
        outExtractByMask = ExtractByMask (raster, file1)  

        # Save the output
        outExtractByMask.save(out_raster + "/" + str(raster_name))


        print("performing statistics on raster. step 1...get a total pixel count from new raster subset")
        count_list = []
        value_list = []
        searched_rows = arcpy.SearchCursor(outExtractByMask)
        total_count = 0
        for row in searched_rows:
            value_list.append(row.VALUE)
            count_list.append(row.COUNT)
            total_count += row.COUNT

        print(str(total_count))

        
        print("step 2...creating tmp.dbf to serve as intermediary")
        tmpTABLE = "tmp.dbf"
        if os.path.exists(tmpTABLE):                                          
            os.remove(tmpTABLE)                                               
        
        arcpy.CreateTable_management(out_vector, tmpTABLE)

        print("step 3... add fields to tmp")
        #ADD FIELDS to tmp table
        arcpy.AddField_management(tmpTABLE, "VALUE", "LONG")
        arcpy.AddField_management(tmpTABLE, "area", "DOUBLE")
        arcpy.AddField_management(tmpTABLE, "percent", "DOUBLE") 
        print("table created")
        
        #UPDATE the tmp table with calculation in added fields
        new_row = arcpy.InsertCursor(tmpTABLE)
        searched_rows = arcpy.SearchCursor(outExtractByMask)
        index = 0
        print("step 4...update the tmp table with calculation in added fields")
        for searched_row in searched_rows:
    
            #print index
            row = new_row.newRow()
            row.VALUE = value_list[index]
            row.area = z*z*1.0*count_list[index]/1000000                                                                                  
            row.percent = count_list[index]*100.0/total_count
            index = index+1
            new_row.insertRow(row)
    
        del row
        del new_row
        del searched_row
        del searched_rows

        print("step 5 ...join the tmp table to attribute table of the newly subset raster file")         

        #join tables to the attribute table of the raster file
        arcpy.MakeRasterLayer_management (outExtractByMask,  "layerName")     
    
        # Join the feature layer to a table
        arcpy.JoinField_management("layerName", "VALUE", tmpTABLE, "VALUE")       
             
        if os.path.exists(tmpTABLE):                                          
            os.remove(tmpTABLE)


print("extract by mask completed")
code snippet creator: http://hilite.me/