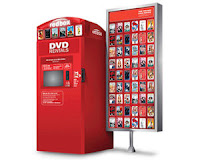
 Redbox is a freestanding DVD and Blu-Ray Kiosk that can be found in various retail and grocery stores. My goal is to determine if there is a connection between race and redbox service areas.
 The goal of this class assignment was to learn how to use the Network Analyst extension in ESRI ArcGIS. A Network Analysis is used on a streets layer to determine service zones and shortest routes. The most important thing about how a network analysis works is that it uses Manhattan distance (Fig. 2) to measure instead of Eucledian distance (Fig. 1). The difference is that a Eucledian distance is linear, for instance a point with a 1 mile radius circle around it. Manhattan distance is better for a network analysis because it is based on roads, a service area should be based on accessibility.
Fig1. Eucledian Distance Fig2. Manhattan Distance
My goal was to see if there is a connection between race and redbox service areas. In order to do this I used Census data from 2000 of Los Angeles County. I used the Census's “Tracts” layer which includes racial and population data. I then loaded the Redbox point shapefile into network analyst by following these steps:
1. Open Network Analyst toolbar and from “Network Analyst” dropdown and select “New Service Area”
2. On same toolbar click “Show/Hide Network Analyst Window” icon
3. Rt. click “Facilities(0)” and select “Load Locations…”
4. Set “Load From:” input to Redbox layer
5. In Table of Contents go to properties of Service Area
6. Go to “Analysis Settings” tab and change Impendence to “Length (miles)” and Default Breaks to “1”.
7. Solve!
This will generate 1 mile service zones for each Redbox unit. I then performed a spatial join with the tracts layer in order to determine the demographic breakdown of Redbox service zones. I summed up the number of Blacks, Whites, Hispanics, Asians and Other in Redbox service zones and for all of Los Angeles. I then calculated the percentages of each race in the Redbox service zones and subtracted them from the baseline demographic breakdown of Los Angeles County. The results show that Redbox units are 5% more likely to be found in areas dominated by White people and 3% less likely to be found in areas dominated by Hispanic people. In conclusion, there is not a significant difference in the demographic breakdown of Redbox service zones and the demographic breakdown of Los Angeles County.
I also created this second map which shows a close-up of the Redbox service zones in the South Bay (Manhattan Beach, Hermosa Beach and Redondo Beach. This map is meant to show what the service zones looks like at a smaller scale.
Source:
Redbox data: http://geocommons.com/overlays/239760 (Dataset derived by merging the features of 'Total IRS Gross Collections (in thousands), USA by State, FY2008' into 'Redbox Kiosk Locations')
The Redbox location data can be downloaded as a KML (Google Earth), shapefile or spreadsheet (CSV).


